
Households cut food shop by 7.5% last year amid cost-of-living crisis
Households in the UK cut their real-terms spending on food and non-alcoholic drinks in the year to March 2023, the Office for National Statistics (ONS) has said.
While nominal spending on the category increased over the period, there was a 7.5% real-terms drop when accounting for inflation, making it the area where households made the biggest cutbacks, the agency said.
The figures suggest households were “either consuming less, or where applicable buying lower quality items”, the ONS said.
Average weekly household expenditure was £567.70 over the year, a nominal increase of £38.90, or 7%, on the previous 12 months.
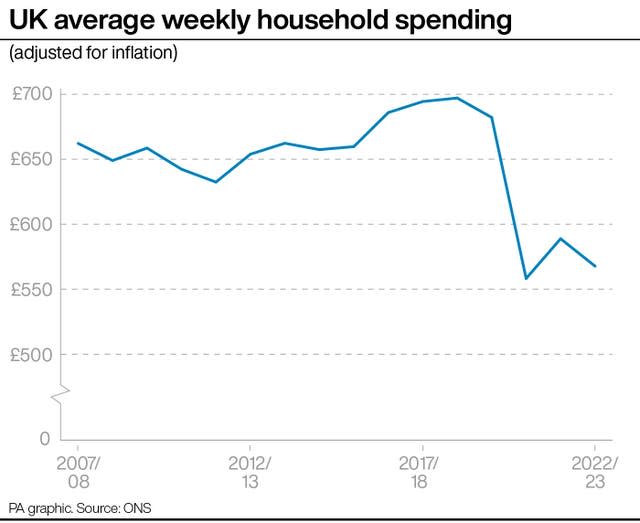
However, after accounting for inflation, this was a real-terms decrease of £21.10, or 4%, the agency said.
The figures cover the period when households were facing skyrocketing energy bills and inflation, brought about in part by Russia’s invasion of Ukraine.
Kevin Brown, savings specialist at Scottish Friendly, called the figures “eye-opening”.
He said of the economic environment at the time: “These were events and mounting costs over which families had no control, other than what they prioritised and where, if they were able to, they would make cuts.
“Along the way, the cost-of-living crisis was renamed a ‘squeeze’. Over a year on from when the ONS data was recorded, a great many family budgets are still in the grip of that squeeze.”
The data also revealed the gap in spending between the most well-off and the poorest households in Britain.
The richest fifth of households’ weekly spending was more than twice that of the poorest fifth of households in the financial year ending March 2023, at £857.30 and £356.90, respectively, the ONS said.
The proportion of households’ spending that goes on food, transport and recreation and culture have returned to pre #COVID pandemic levels, while restaurants and hotels remain below those levels. pic.twitter.com/JptkOdNFLe
— Office for National Statistics (ONS) (@ONS) August 23, 2024
The average household continued to spend the largest proportion of its weekly budget on housing, fuel and power.
Spending on the category rose 18% on a nominal basis, but fell 2% when accounting for inflation, indicating that people were trying to cut back despite sharp price rises.
While all households experienced a nominal increase in energy prices, the poorest fifth of households saw the largest percentage increase of 49%, or £11.40, compared with a 42% or £12.50 increase for the richest fifth of households.
This was a real-terms decrease of 18% or £7.40 for the poorest fifth of households and a 21% or £11.10 decrease for the richest fifth.
The ONS said in its data release that the figures suggest that poorer households “have less capacity to offset increased energy prices by either using less or switching tariffs, thus are probably more vulnerable to increased energy prices”.
Of the £567.70 average spend, £105.70 a week went on the housing, fuel and power category, which includes rent, energy and water bills and maintenance costs.

