
What the latest NHS performance figures for England show
Response times for ambulances have continued to improve and a key A&E target has been hit for the first time, though the number of patients waiting more than 18 months for treatment has increased.
Here are the main figures from the latest NHS performance data for England:
– Overall waiting list
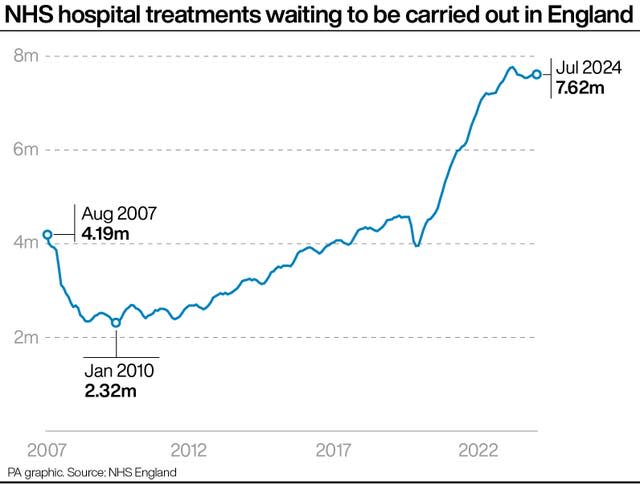
The size of the waiting list for routine hospital treatment was unchanged in July, following three consecutive monthly increases.
An estimated 7.62 million treatments were waiting to be carried out at the end of the month, relating to 6.39 million patients.
The list hit a record high in September 2023 with 7.77 million treatments and 6.50 million patients, after which the figures fell for several months before rising in April, May and June of this year.
The size of the list has been growing for much of the last 10 years, passing three million in 2014, four million in 2017, five million in 2021 and seven million in 2022.
In February 2020, the last full month before the start of the Covid-19 pandemic, the list stood at 4.57 million.
Since February 2024, treatments by community services are no longer included in the data, meaning the overall number of incidences of people waiting for treatment in England is likely to be higher than the latest figures.
Community services cover treatments and procedures that are delivered mainly in people’s homes, as well as care homes, clinics, schools, other care facilities and community hospitals.
– Long waits for treatment
Some 2,738 patients had been waiting more than 18 months to start routine treatment at the end of July, up from 2,621 in June.
The previous government and NHS England set the ambition of eliminating all waits of more than 18 months by April 2023, excluding exceptionally complex cases or patients who choose to wait longer.
There were 50,860 patients who had been waiting more than 65 weeks to start treatment at the end of July, down from 58,024 in June.
The target to eliminate all waits of more than 65 weeks is now September 2024, having previously been March 2024.
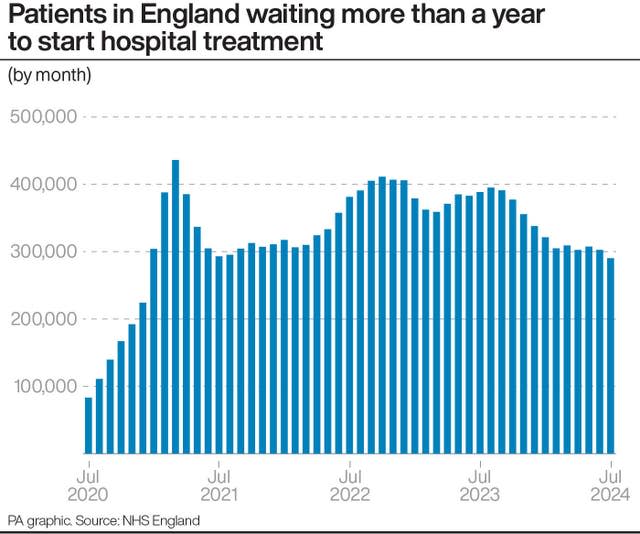
Meanwhile, 290,326 people had been waiting more than 52 weeks to start routine hospital treatment at the end of July, down from 302,693 at the end of June.
This is the lowest figure since December 2020.
The previous government and NHS England set the ambition of eliminating all waits of more than a year by March 2025.
– Accident & emergency waits
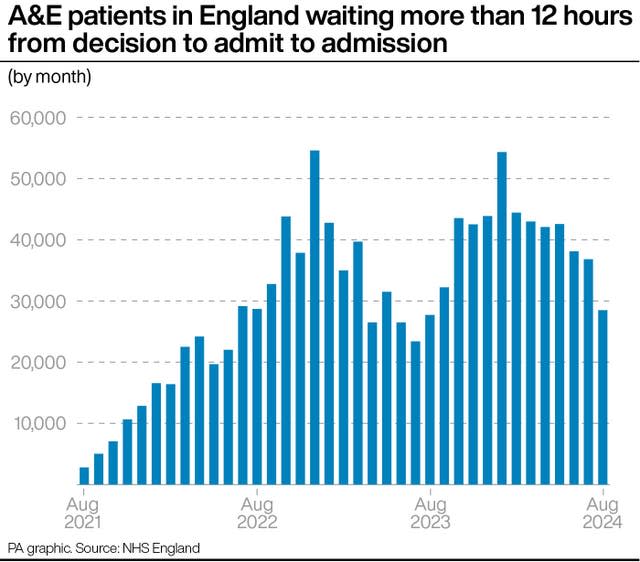
There were 28,494 people who had to wait more than 12 hours in A&E departments in August from a decision to admit to actually being admitted, down from 36,806 in July and the lowest figure for 12 months.
The record high for a calendar month is 54,573, which occurred in December 2022.
The number waiting at least four hours from the decision to admit to admission also fell, standing at 116,489 in August, down from 129,330 in July and the lowest figure for 13 months.
Some 76.3% of patients were seen within four hours in A&Es last month, up from 75.2% in July and the highest level since August 2021.
The NHS recovery plan set a target of March this year for 76% of patients attending A&E to be admitted, transferred or discharged within four hours.
It is the first time this target has been hit.
A target of 78% has been set for March 2025.
– Cancer referrals
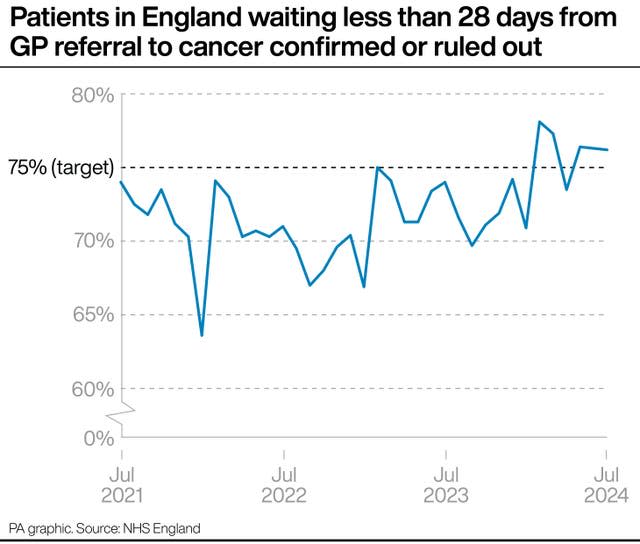
A total of 76.2% of patients urgently referred for suspected cancer in July were diagnosed or had cancer ruled out within 28 days.
This is down very slightly from 76.3% the previous month but is above the target of 75%.
It is only the fifth time the target has been exceeded since it was introduced in autumn 2021.
The proportion of patients who had waited no longer than 62 days in July from an urgent suspected cancer referral or consultant upgrade to their first definitive treatment for cancer was 67.7%, up slightly from 67.4% in June.
The target is 85%.
GPs in England made 286,720 urgent cancer referrals in July, up from 259,681 in June and also up year on year from 263,897 in July 2023.
– Cancer diagnostic waiting list
The number of patients waiting longer than 62 days since an urgent GP referral for suspected cancer was 17,545 in the week ending August 4 2024, down from 18,224 in the week ending July 7.
The figure stood at nearly 34,000 at the end of September 2022.
Most of the patients included in this total do not have cancer and are waiting for a diagnostic test, while nearly one in five do have cancer and are waiting for treatment.
The previous government and NHS England set the ambition of returning this figure to pre-pandemic levels by March 2023.
The average weekly figure for the pre-pandemic month of February 2020 (covering the four weeks to March 1) was 13,463.
– Ambulance response times
The average response time in August for ambulances dealing with the most urgent incidents, defined as calls from people with life-threatening illnesses or injuries, was eight minutes and three seconds.
This is down slightly from eight minutes and 15 seconds in July and is the shortest time since June 2021 but is above the target standard response time of seven minutes.
Ambulances took an average of 27 minutes and 25 seconds last month to respond to emergency calls such as heart attacks, strokes and sepsis.
This is down from 33 minutes and 25 seconds in July and is the shortest time since May 2021, while the target is 18 minutes.
Response times for urgent calls, such as late stages of labour, non-severe burns and diabetes, averaged one hour, 30 minutes and 33 seconds in August, down from two hours, one minute and 21 seconds in July and the shortest time since January 2023.
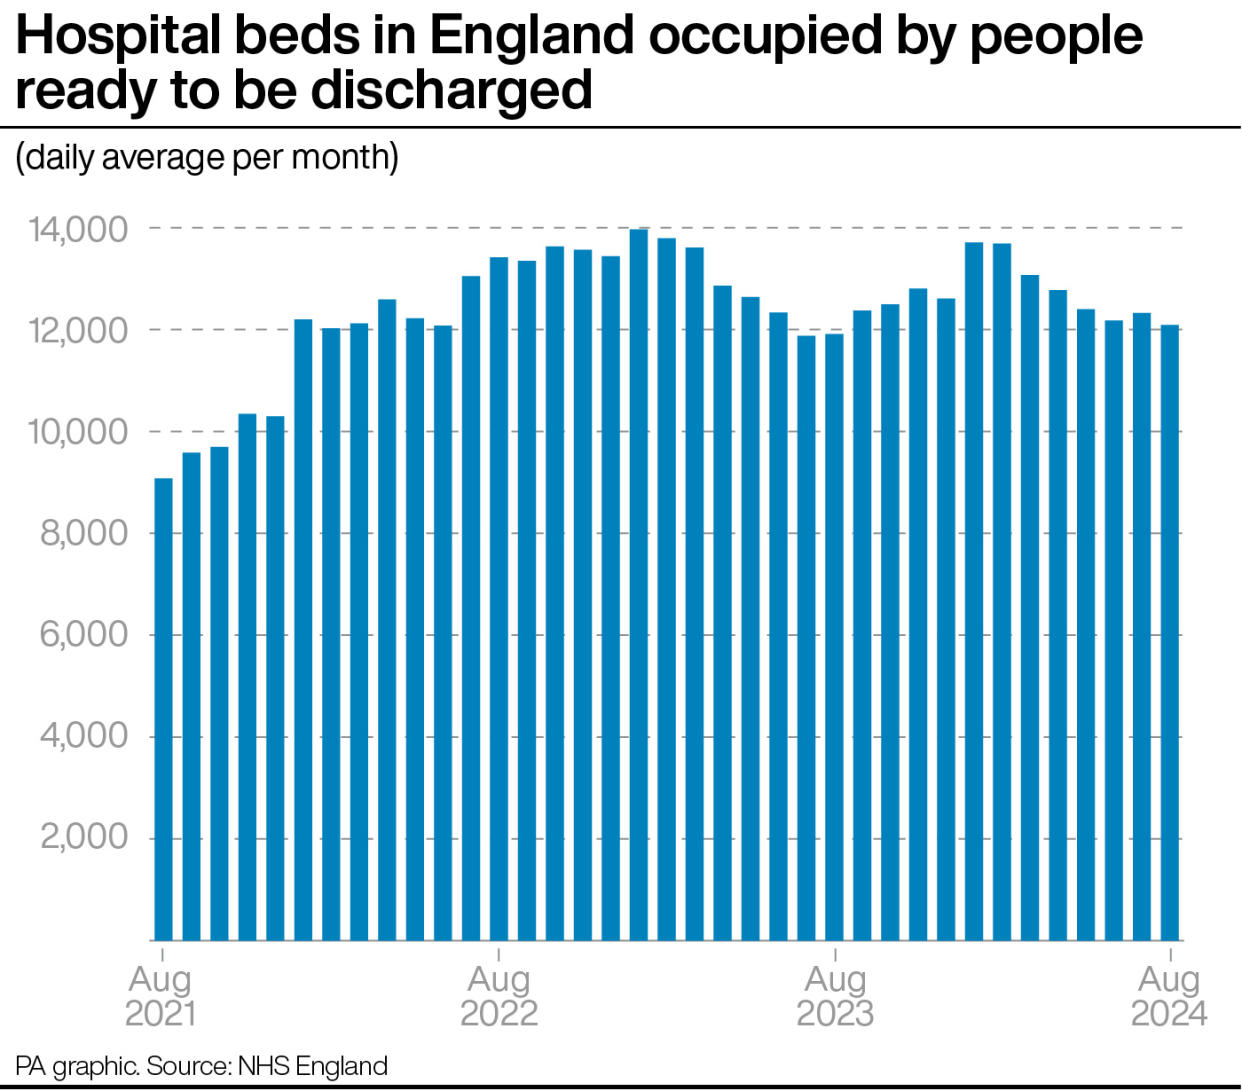
– Delayed discharges
An average of 12,092 hospital beds per day last month were occupied by people ready to be discharged.
This is lower than the average of 12,326 in July and is also the lowest figure for a year, since 11,913 in August 2023.
On average, 44.7% of patients ready to leave hospital last month were actually discharged each day, broadly unchanged from 44.8% July.
– Diagnostic tests
More than 360,000 people had been waiting longer than six weeks for a key diagnostic test in July.
Some 364,544 patients, 22.4% of the total, were waiting longer than six weeks for one of 15 standard tests, including an MRI scan, non-obstetric ultrasound or gastroscopy.
The figure is down from 375,416 (22.9% of the total) in June, and lower than the equivalent figure for July 2023, which was 405,977 (25.4%).
The NHS elective recovery plan sets the ambition that 95% of patients needing a diagnostic test receive it within six weeks by March 2025.

